
Traders and investors use a variety of tactics and tools to make educated decisions in the fast-paced world of the financial markets. The use of moving averages (MAs) to examine market trends and probable price movements is one such method that has grown in popularity. The 9-day and 15-day moving averages stand out among the many moving average types because of their exceptional capacity to shed light on short- to medium-term price movements. We will go into the nuances of the 9 and 15 moving average technique in this post and examine its importance in trading.
What Are Moving Averages?
It’s crucial to comprehend the fundamental idea behind moving averages before getting into the intricacies of the 9 and 15 moving average technique. A moving average is a popular technical indicator that creates a continuously updated average price to smooth out price data. It is calculated by averaging the prices of various assets over a given time frame. This smoothing effect gives traders a clearer image of the general market direction by removing short-term price volatility and assisting in the identification of trends.
The 9 and 15 Moving Average Technique
Using a 9-day moving average (9MA) and a 15-day moving average (15MA) simultaneously is known as the 9 and 15 moving average technique. On a price chart, these two moving averages are displayed, and the interactions between them can provide traders with useful information.
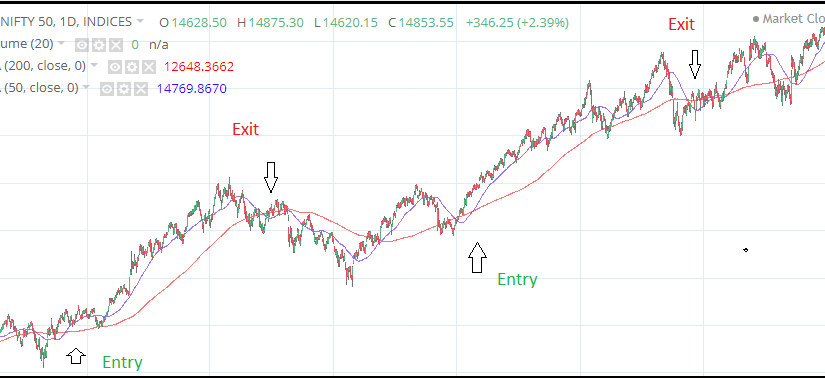
- Crossing Over: Identification of crossings between the 9 and 15 moving averages is one of the main applications of this technique. A prospective rise is signalled when the 9MA crosses above the 15MA, generating a positive signal. In contrast, a negative signal is produced when the 9MA crosses below the 15MA, indicating the possibility of a decline. For traders, these crossings are frequently regarded as entry or exit points.
- Confirmation of Trends: The 9MA and 15MA’s relative positions also serve to validate current trends. A strong bullish trend is present if the 9MA is continuously higher than the 15MA and both are sloping upwards. On the other hand, a strong bearish trend is indicated if the 9MA continually closes below the 15MA and both are trending downward.
- Support and Resistance Levels: Traders can also find probable support and resistance levels by using the 9 and 15 moving average approach. Moving averages frequently serve as dynamic support or resistance when prices are close to them, affecting the price’s capacity to maintain or reverse its trend.
- Risk Management: Risk management choices are frequently made by traders using the crossovers and trend confirmations offered by the 9 and 15 moving average approach. The indications produced by these moving averages can be used to strategically establish stop-loss and take-profit levels.
Implementing the 9 and 15 Moving Average Technique: A Practical Approach
The 9 and 15 moving average approach calls for more than just theoretical understanding to be included into your trading plan. Let’s look at how to use this strategy efficiently in practise:
1. Chart Setup:
Choose the trading instrument and timeframe you want to use before you do anything else. Daily, 4-hour, and 1-hour charts are popular choices. On the price chart, draw the 9-day and 15-day moving averages. The majority of trading platforms include features to make adding these moving averages simple.
2. Identifying Trends and Signals:
Crossovers: Crossovers should be closely watched between the 9MA and 15MA. As was previously said, when the 9MA crosses above the 15MA, a bullish signal is formed, and when it crosses below the 15MA, a bearish signal is generated.
Trend Confirmation: Verify trends by examining how the two moving averages are positioned in relation to one another. The 9MA and 15MA should both slope upwards and constantly remain above each other during a bullish trend. The 9MA should remain below the 15MA in a bearish trend, with both moving averages sloping downward.
3. Entry and Exit Strategies:
Bullish Signal: A bullish trend is verified when the 9MA crosses above the 15MA; at this time, you might want to consider opening a long (buy) position. After the crossover, traders frequently wait for a small pullback to enter at a better price.
Bearish Signal: If a bearish trend is verified and the 9MA crosses below the 15MA, this may indicate a good time to enter a short (sell) position. Similar to that, waiting for a pullback can give you a better chance to enter.
Exit Points: In a bullish trend, think about selling your long position when the 9MA crosses below the 15MA. Conversely, when the 9MA crosses above the 15MA during a bearish trend, an exit can be thought about.
4. Risk Management:
Use the 9 and 15 moving average signals in conjunction with appropriate risk management strategies. Set take-profit levels to ensure profits and stop-loss orders to protect against potential losses. The separation between the moving averages at the moment of entrance can be used to guide the placement of these levels.
5. Filter and Confirm Signals:
Consider adding additional indicators or tools to improve the precision of the signals produced by the 9 and 15 moving average technique. Utilising a momentum oscillator, such as the Relative Strength Index (RSI), for instance, can help validate overbought or oversold levels and improve the accuracy of trade entry signals.
6. Practice and Adaptation:
The 9 and 15 moving average technique requires practise and adaption to become proficient, just like any other trading strategy. As you gain experience, you’ll be able to judge when to follow the indications produced by the moving averages and when to proceed cautiously, especially during times of turbulence in the market.
7. Continuous Learning:
Keep abreast with market developments, news, and macroeconomic issues that could affect price changes. Knowing the current market dynamics complements the technical elements of your trading approach because they can change quickly.
Limitations and Considerations
While the 9 and 15 moving average approach provides insightful information, it’s critical to recognise its limitations and take into account additional indicators or tools for an all-encompassing trading plan. In turbulent or sideways markets, this strategy might not be as beneficial because crosses can result in misleading signals. Furthermore, it might be dangerous to only rely on moving averages without taking into account fundamental variables, market mood, or other technical indications.
In Conclusion
In the world of trading, the 9 and 15 moving average strategy is a well-liked and comparatively simple method. It is a useful tool in a trader’s toolbox since it can spot trends, produce signals, and help control risk. It should be combined with other types of analysis, though, and customised to the trader’s particular style and risk appetite, as with any trading method. Learning such strategies can enable traders to make informed decisions in the pursuit of their financial objectives as markets continue to change.
A useful instrument that can give important insights into short- to medium-term price movements is the 9 and 15 moving average approach. By include this method in your trading approach, you may pinpoint probable entry and exit points, validate trends, and improve risk management. Keep in mind that there are inherent dangers in trading, and no technique will guarantee success. It is crucial to integrate the information provided by the 9 and 15 moving averages with a comprehensive trading strategy that takes into account fundamental analysis, market sentiment, and responsible risk management. The 9 and 15 moving average strategy might grow in importance as you hone your abilities and adjust to shifting market conditions.
Frequently Asked Questions (FAQ) – 9 and 15 Moving Average Technique in Trading
What is the 9 and 15 moving average technique in trading?
The 9 and 15 moving average approach is a trading strategy that uses two moving averages to analyse market trends and future price movements: a 9-day moving average (9MA) and a 15-day moving average (15MA). To make wise trading decisions, traders pay close attention to crossovers, trend confirmations, and the relative locations of various moving averages.
How do moving averages work in trading?
By estimating the average price of an item over a given time frame, moving averages smooth out price data. This smoothing effect makes it simpler to spot patterns by filtering out short-term volatility and presenting a clearer view of the overall price direction.
What is a bullish signal in the context of the 9 and 15 moving average technique?
When the 9-day moving average (9MA) crosses above the 15-day moving average (15MA), it represents a positive indication. This crossing could be interpreted as a signal to take into account opening a long (buy) position because it points to a probable upswing in the market.
What is a bearish signal in this technique?
When the 9-day moving average (9MA) crosses below the 15-day moving average (15MA), a bearish signal is formed. This crossover suggests a possible downward trend and may be a warning to think about taking a short (sell) position.
Can the 9 and 15 moving average technique be used on any time frame?
Yes, different time frames, such as daily, hourly, or even shorter intervals, can use the 9 and 15 moving average technique. The trading style and objectives of the trader influence the time frame selection.