

Candlestick patterns are a vital tool in technical analysis, helping traders and investors make informed decisions in financial markets. These patterns provide insights into market sentiment, potential price reversals, and trends. In this comprehensive guide, we will explore everything you need to know about candlestick patterns, from their history to common patterns and practical trading strategies.
History of Candlestick Patterns
Candlestick charting originated in Japan during the 17th century and was used to track the price of rice. Munehisa Homma, a Japanese rice trader, is often credited with developing the early principles of candlestick analysis. The technique eventually made its way to the Western world and became popular in the 20th century.
Anatomy of a Candlestick
A typical candlestick consists of several components:
- Open: The price at which an asset opened during a specific time period.
- Close: The price at which an asset closed during the same time period.
- High: The highest price reached during the time period.
- Low: The lowest price reached during the time period.
Candlesticks can be either bullish or bearish, depending on whether the price closed higher or lower than the open:
- Bullish Candlestick: The close is higher than the open, indicating buying pressure.
- Bearish Candlestick: The close is lower than the open, indicating selling pressure.
Common Candlestick Patterns
Numerous candlestick patterns exist, but here are some of the most widely recognized and traded patterns:
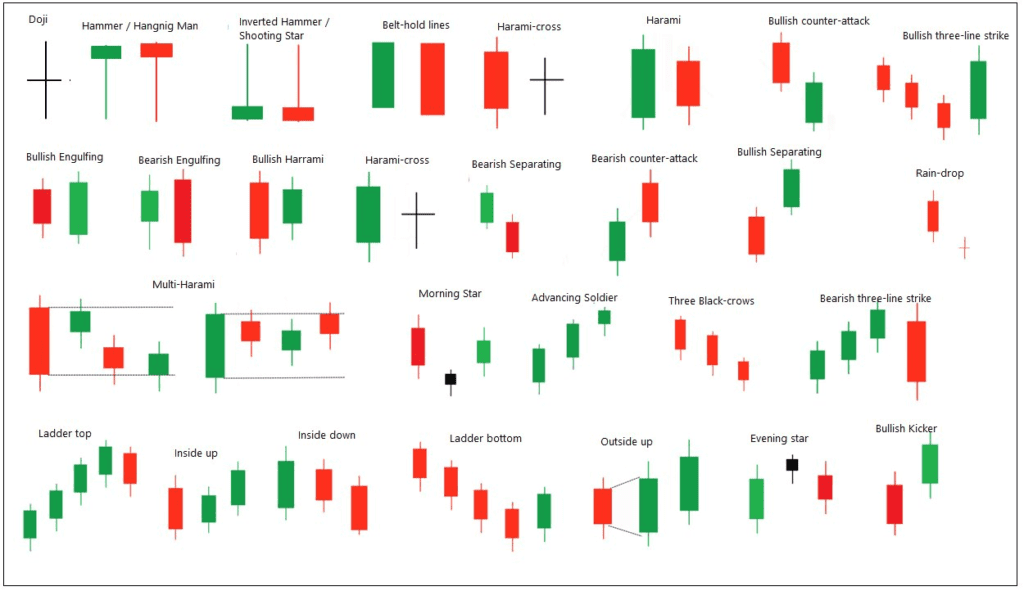
a. Doji: A doji represents indecision in the market. It has a small body and occurs when the open and close are nearly equal.
b. Hammer: A bullish reversal pattern that appears at the end of a downtrend. It has a small body and a long lower shadow, indicating potential buying pressure.
c. Shooting Star: The opposite of the hammer, a shooting star is a bearish reversal pattern found at the end of an uptrend. It has a small body and a long upper shadow, suggesting potential selling pressure.
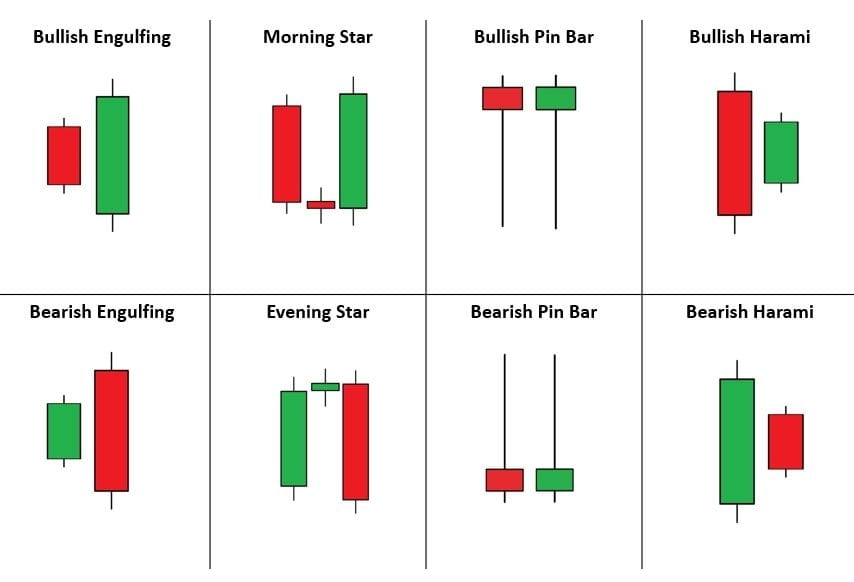
d. Engulfing Patterns: Bullish engulfing and bearish engulfing patterns occur when the current candlestick’s body completely engulfs the previous candlestick’s body, signaling potential reversals.
e. Morning Star and Evening Star: These are three-candle patterns. The morning star is bullish and signals a potential uptrend, while the evening star is bearish and suggests a potential downtrend.
Trading Strategies Using Candlestick Patterns
Candlestick patterns can be powerful tools when incorporated into trading strategies:
a. Confirmation: Candlestick patterns are most effective when combined with other technical indicators, such as moving averages or relative strength, to confirm trading signals.
b. Trend Reversals: Many traders use candlestick patterns to identify potential trend reversals. For example, a bearish engulfing pattern at the end of an uptrend could signal a potential reversal to the downside.
c. Entry and Exit Points: Candlestick patterns can help traders identify optimal entry and exit points. For instance, a bullish hammer pattern might indicate a good entry point for a long trade.
d. Stop Loss and Take Profit: Traders can use candlestick patterns to set stop-loss and take-profit levels, helping manage risk and lock in profits.
Limitations and Risks
While candlestick patterns can provide valuable insights, they are not foolproof. It’s essential to be aware of their limitations and risks:
a. False Signals: Candlestick patterns can sometimes produce false signals, leading to losses if not used in conjunction with other analysis tools.
b. Market Conditions: Candlestick patterns may perform differently in different market conditions, such as trending or ranging markets.
c. Over-Reliance: Over-reliance on candlestick patterns without considering other factors can be risky. It’s crucial to use them as part of a broader trading strategy.
Conclusion
Candlestick patterns are a valuable tool for traders and investors, offering insights into market sentiment and potential price movements. By understanding the history, anatomy, and common patterns, along with using them in conjunction with other technical analysis tools, you can make more informed decisions in the financial markets. However, it’s essential to remember that no trading method is infallible, and risk management remains crucial in trading.