

Trading and investing professionals frequently use technical analysis to interpret price changes and come to well-informed decisions in the complex world of financial markets. Candlestick patterns are one of the most frequently used tools in technical analysis. These graphic depictions of price movement offer insightful analyses of market sentiment and potential trend reversals. In this article, we’ll delve into the fascinating world of candlestick patterns and look at their significance for traders in the financial markets as well as their history and key elements.
Historical Roots of Candlestick Patterns
Candlestick charts have a long, illustrious history that dates to Japan in the 18th century. The development of candlestick charting methods to evaluate and forecast rice prices is credited to Japanese rice trader Munehisa Homma. This approach changed throughout the ages, and in the 20th century, it made its way into more extensive financial markets, in part because of the pioneers of technical analysis like Charles Dow.
Anatomy of a Candlestick
Each of the parts that make up a candlestick tells a story about the price movement over a certain time frame, whether it be a minute, an hour, a day, or longer. The body and the wick (or shadow) are the two main components of a candlestick.
Body: The opening and closing prices for the time period under consideration are shown in the rectangular-shaped body. The body is typically colored green or white, signifying a bullish (upward) movement, if the closing price is higher than the opening price. A body that is red or black, on the other hand, denotes a bearish (downward) movement.
Wick or Shadow: Wicks or shadows are the thin lines that extend above and below the body. They serve as a snapshot of the highest and lowest prices experienced during that time.
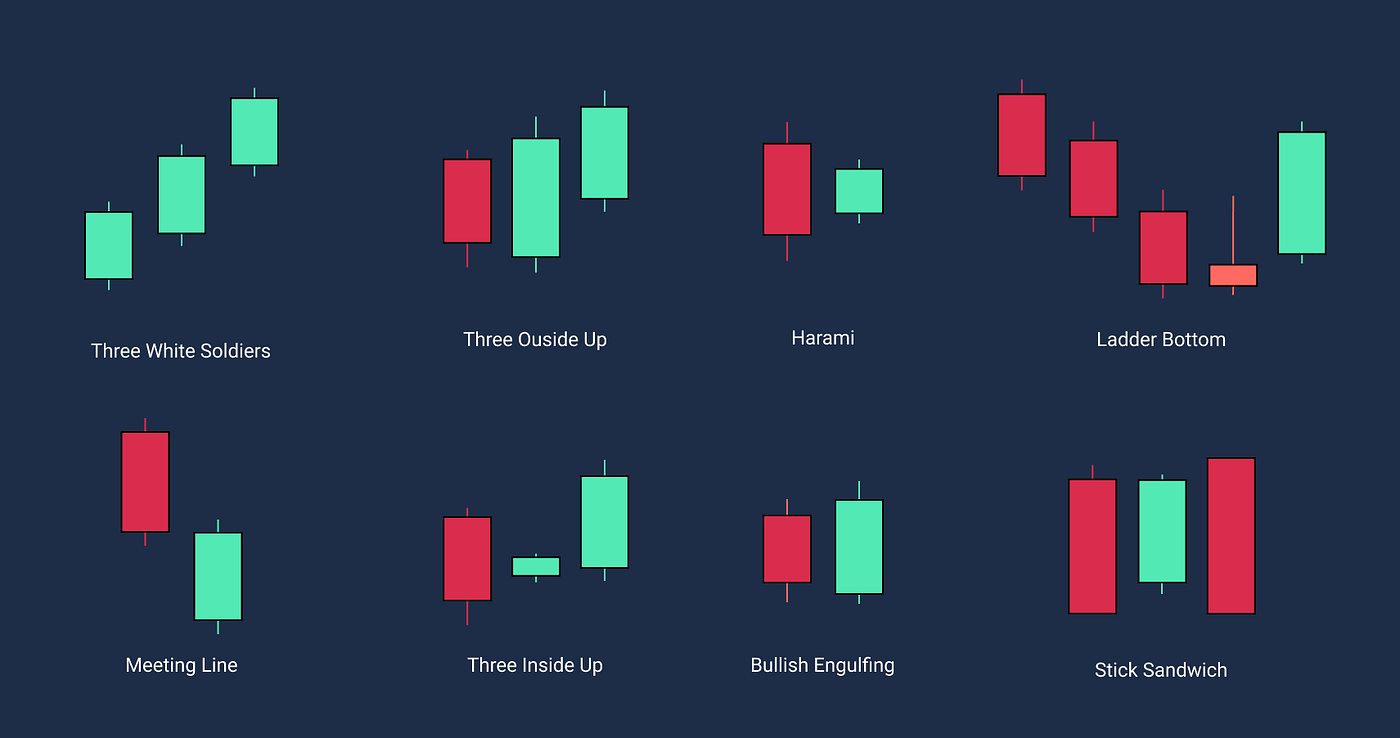
Common Candlestick Patterns
Doji: A Doji is a small-bodied candle that develops when the opening and closing prices are nearly equal. It indicates market hesitancy and frequently heralds a potential reversal.
The bodies of the Hammer and Hanging Man patterns are small, and the lower wicks are lengthy. A Hammer that appears after a downtrend indicates a potential upside reversal, whereas a Hanging Man that appears after an uptrend indicates a potential downside reversal.
Bullish and bearish engulfing patterns feature a candlestick completely eclipsing the previous one. In contrast, a bearish engulfing points to a potential downward reversal, a bullish engulfing suggests a potential upward reversal.
The three-candlestick patterns known as Morning Star and Evening Star indicate potential reversals. In contrast to the Evening Star, which appears after an uptrend and suggests a potential downward reversal, the Morning Star appears after a downtrend and suggests a potential upward reversal.
Practical Application of Candlestick Patterns
Candlestick patterns are used by investors and traders to better time their trades and forecast future price movements. A trader may decide to enter or exit a position after spotting patterns on a chart like the Doji or the Engulfing Pattern.
It’s crucial to remember that while candlestick patterns are strong tools, they work best when combined with other technical analysis techniques. Furthermore, a pattern’s reliability is significantly influenced by market circumstances and the context in which it appears.
Challenges and Limitations
The limitations of candlestick patterns are the same as those of any other technical analysis tool. False signals can happen, and basing decisions solely on candlestick patterns without taking into account other aspects can result in poor choices. The same pattern can have various implications depending on the larger market context, so pattern interpretation also calls for skill and experience.
Conclusion
The visual language of candlestick patterns conveys a lot about market sentiment and potential trend reversals. By taking the time to comprehend and master these patterns, traders and investors can give themselves a significant advantage when navigating the complex financial markets. To make wise and informed decisions, it is essential to approach candlestick analysis from a well-rounded standpoint and combine it with other technical and fundamental analysis tools. Candlesticks’ glow not only illuminates the charts but also shows the way to more strategic and informed trading.